If your reverse osmosis plant’s output has been quietly declining, or permeate quality isn’t what it used to be, RO membrane fouling is almost always the underlying cause. It’s the most common — and most expensive — problem in RO operations, and it rarely announces itself with a dramatic failure. Instead, it shows up as a slow, gradual drop in performance that plant operators often overlook until productivity or water quality has already taken a real hit.
This article walks through the early warning signs of membrane fouling, what typically causes it in Pakistani industrial and commercial settings, and a practical reverse osmosis maintenance schedule you can use to catch problems before they become expensive ones.
What RO Membrane Fouling Actually Is
RO membrane fouling occurs when unwanted material — organic matter, biological growth, scale-forming minerals, or fine particulates — builds up on the membrane surface and restricts water flow. It’s distinct from membrane degradation, which is chemical attack that breaks down the membrane itself; fouling is purely a buildup problem, and in most cases it’s reversible if caught early with the right cleaning approach
There are four main categories of fouling in RO systems:
- Scaling — mineral deposits (calcium carbonate, calcium sulfate, silica) that form when feed water exceeds their solubility limit.
- Biofouling — bacterial growth on the membrane surface, common in feed water with inadequate disinfection.
- Colloidal/particulate fouling — fine suspended solids that weren’t fully removed by pretreatment.
- Organic fouling — natural organic matter or oils that coat the membrane surface.
Early Warning Signs of Fouling
Most operators catch fouling far too late because they’re watching for a single symptom instead of a pattern. Watch for these together:
- Rising differential pressure across the membrane element — usually the earliest and most reliable indicator.
- Declining normalized permeate flow at a constant feed pressure.
- Increasing salt passage (rising conductivity in permeate), which signals the membrane surface is compromised or scaled.
- Higher feed pressure required to maintain the same output — your pumps are working harder for the same result.
- Visible discoloration or slime on membrane elements during inspection, often a sign of biofouling.
Tracking these parameters against baseline (day-one) readings is far more useful than looking at any single reading in isolation — this is exactly why consistent real-time monitoring of pressure, flow, and conductivity data matters more than periodic manual checks.
What Causes Fouling in Pakistani Industrial Settings
Feed water quality varies a lot across Pakistan, and this directly affects fouling risk:
- High hardness groundwater, common in parts of Punjab, increases scaling risk if pretreatment softening isn’t adequate.
- Surface water sources used by some industrial plants carry higher organic and biological load, raising biofouling risk.
- Textile, food & beverage, and pharma effluent-adjacent feed streams can introduce oils or fine particulates if pretreatment filtration isn’t matched to the actual feed characteristics.
- Inconsistent power supply, leading to frequent shutdowns and restarts, disturbs stable biofilm control and accelerates biofouling in some systems.
A plant in Karachi drawing from a brackish or surface-influenced source, for example, typically needs a more robust pretreatment train (multimedia filtration plus antiscalant dosing) than a plant in Lahore running on treated municipal supply — using identical pretreatment specs for both is one of the most common causes of premature fouling.
Reverse Osmosis Maintenance Schedule
A disciplined reverse osmosis maintenance schedule is the single biggest factor in extending membrane life. Here’s a practical baseline:
Task | Recommended Frequency |
Differential pressure & flow logging | Daily |
Feed water quality check (turbidity, SDI, hardness) | Weekly |
Visual inspection of pretreatment filters | Weekly |
Chemical (CIP) cleaning | Every 3–6 months, or when pressure rises 10–15% above baseline |
Membrane autopsy on failed elements | As needed, when cleaning doesn’t restore performance |
Full membrane replacement | Typically 3–5 years, depending on feed water quality and cleaning history |
This schedule should flex based on your actual feed water — a plant with poor feed quality or frequent power interruptions may need CIP cleaning every 2–3 months rather than 6.
Cleaning vs Replacement: How to Decide
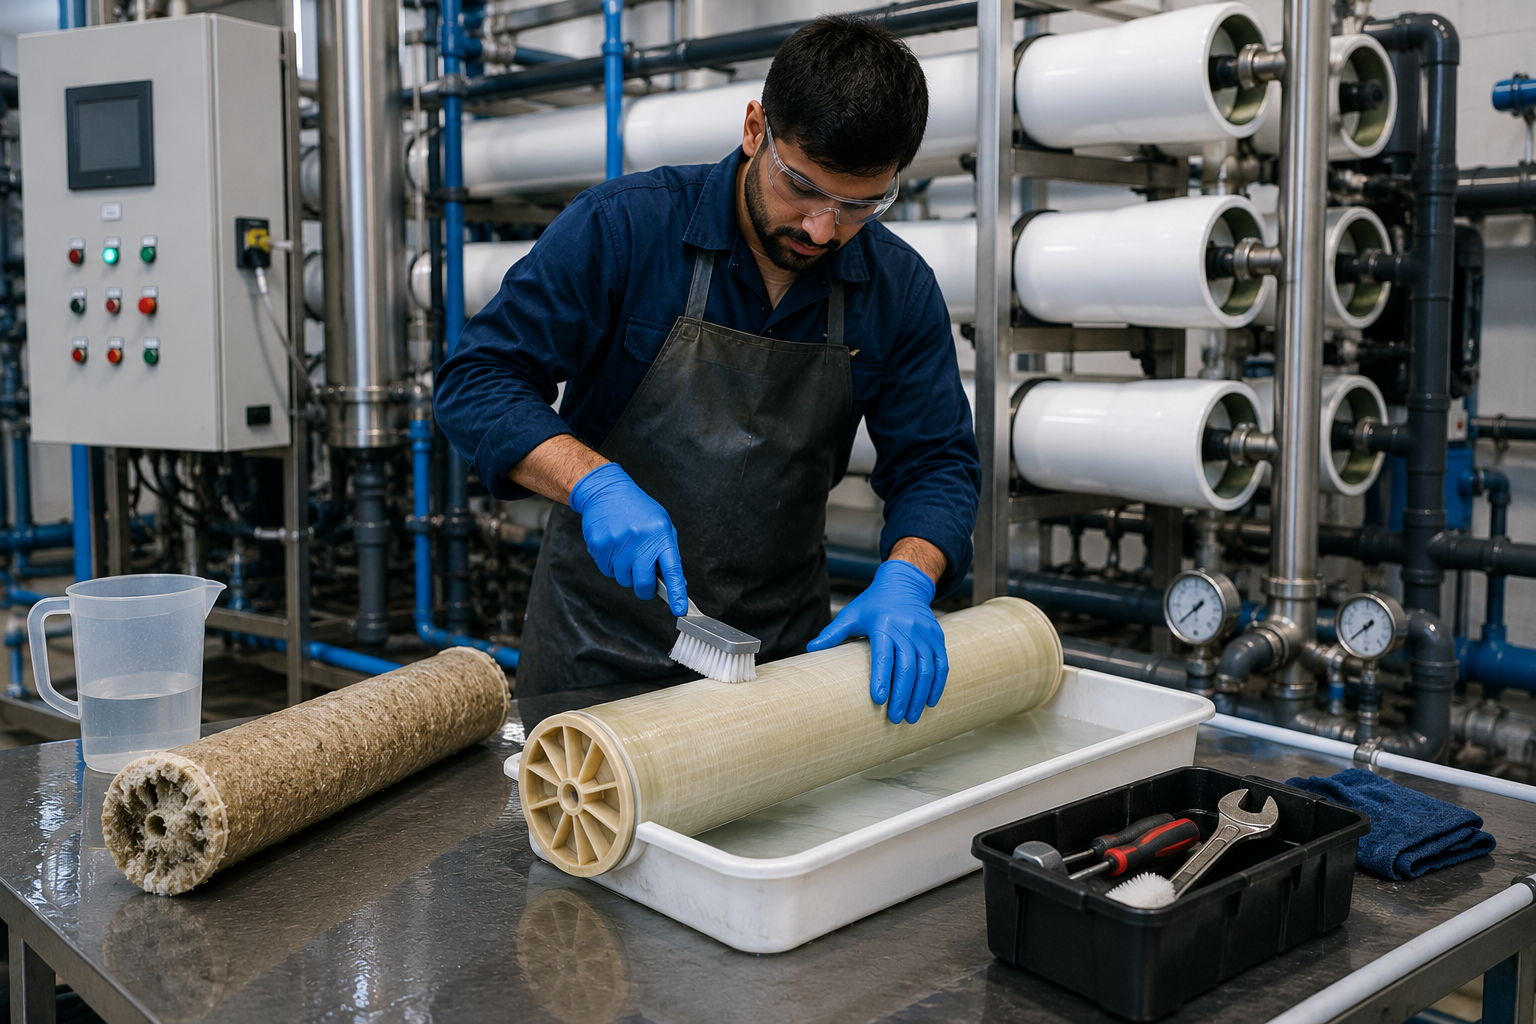
Not every fouling problem means new membranes. A properly executed Cleaning In Place (CIP) procedure — using the correct low-pH or high-pH cleaning chemistry matched to the fouling type — restores most of a membrane’s original performance if fouling is caught early. As a rule of thumb:
- If normalized flow recovers to within 90–95% of baseline after CIP, the membrane is healthy and cleaning is working.
- If two to three consecutive cleanings fail to restore performance, or salt passage keeps climbing, the membrane has likely reached irreversible fouling or degradation and replacement is the more cost-effective option.
- Running a compromised membrane past this point usually costs more in energy and reduced output than replacing it would.
The Real Cost of Ignoring Fouling
Delayed maintenance doesn’t just risk membrane failure — it quietly increases your electricity bill (higher feed pressure needed for the same output), increases downstream chemical dosing (to compensate for higher salt passage), and can compromise product or process water quality in industries like pharma and food & beverage where consistency is non-negotiable. Regular water quality testing using reliable water testing kits alongside your monitoring instrumentation gives you the early data needed to act before any of this happens.
FAQ
Q1. How often should RO membranes be replaced?
Most industrial RO membranes last 3–5 years with proper pretreatment and a consistent maintenance schedule, though poor feed water quality or infrequent cleaning can shorten this considerably. Tracking performance against baseline readings is a better guide than relying on a fixed calendar date alone.
Q2. What is the first sign of RO membrane fouling?
Rising differential pressure across the membrane at a constant feed flow is usually the earliest reliable indicator, often appearing before any noticeable drop in water quality. This is why daily pressure and flow logging matters more than periodic quality checks alone.
Q3. Can a fouled RO membrane be restored without replacement?
In most cases, yes — a correctly matched CIP cleaning routine restores the majority of lost performance if fouling is caught early. Once two or three cleanings fail to recover flow or salt rejection, the membrane has usually reached a point where replacement is more economical.
Q4. Does poor pretreatment increase fouling risk?
Significantly. Inadequate multimedia filtration, missing antiscalant dosing, or under-sized cartridge filters are among the most common root causes of premature fouling, regardless of membrane brand or quality. Pretreatment should always be matched to actual feed water characteristics, not assumed.
Conclusion
RO membrane fouling is manageable — and largely preventable — when it’s tracked consistently rather than discovered after output has already dropped. A disciplined reverse osmosis maintenance schedule built around daily monitoring, regular CIP cleaning, and feed water testing extends membrane life significantly and protects both water quality and operating cost. WCSP has supported industrial and commercial reverse osmosis plants across Pakistan since 2007 and can help you build a maintenance program suited to your specific feed water conditions.
Frequently Asked Question's
Most industrial RO membranes last 3–5 years with proper pretreatment and a consistent maintenance schedule, though poor feed water quality or infrequent cleaning can shorten this considerably. Tracking performance against baseline readings is a better guide than relying on a fixed calendar date alone.
Rising differential pressure across the membrane at a constant feed flow is usually the earliest reliable indicator, often appearing before any noticeable drop in water quality. This is why daily pressure and flow logging matters more than periodic quality checks alone.
In most cases, yes — a correctly matched CIP cleaning routine restores the majority of lost performance if fouling is caught early. Once two or three cleanings fail to recover flow or salt rejection, the membrane has usually reached a point where replacement is more economical.
Significantly. Inadequate multimedia filtration, missing antiscalant dosing, or under-sized cartridge filters are among the most common root causes of premature fouling, regardless of membrane brand or quality. Pretreatment should always be matched to actual feed water characteristics, not assumed.