Your last water sample passed the lab test on Monday. By Wednesday, your effluent was in violation — and you had no idea until the EPA inspector showed up. This scenario plays out regularly across textile mills in Faisalabad, pharmaceutical plants in Karachi, and food processing facilities in Lahore. According to the Pakistan Council of Research in Water Resources (PCRWR), over 80% of industrial water samples tested across Pakistan’s major cities showed contamination levels above permissible limits — yet most facilities still rely on manual, batch-based testing to stay compliant.
Real-time water quality monitoring changes that equation entirely. Instead of snapshots taken hours or days apart, you get a continuous data stream from sensors embedded directly in your process lines, holding tanks, and discharge points. This article breaks down how IoT-based monitoring works, which parameters matter most for your industry, and why plants that upgrade now are building a meaningful competitive and compliance advantage over those that wait.
The gap between what your water quality is and what you think it is can cost you licenses, contracts, and equipment. Let’s close that gap.
Why Manual Water Testing Is Costing You More Than You Think
Manual grab-sample testing gives you a single data point from a specific moment. Everything that happened before the sample was collected, and everything that happens after, remains invisible.
For a textile mill running discharge 16 hours a day, a twice-daily lab test captures roughly 0.2% of your actual effluent output. The other 99.8% goes completely unmonitored.
That 0.2% test coverage creates serious exposure. Dye bath cycles, dyeing auxiliaries, and caustic wash cycles can spike pH and color load for 45-minute windows between tests. A single undetected peak of heavy metals — chromium from leather processing in Sialkot, for instance — can exceed NEQS limits by a factor of 10 without triggering any internal alarm.
Beyond compliance, manual testing introduces time lag. A contamination event detected at 9 a.m. may have started at 2 a.m. By the time you respond, raw wastewater may have already backed up into a membrane bioreactor or saturated your RO pre-treatment media, triggering expensive cleaning or replacement cycles.
The World Bank estimates that reactive water quality management costs industrial facilities 3 to 5 times more than proactive, sensor-based monitoring over a 5-year horizon. For a mid-sized Lahore textile mill processing 500,000 liters per day, the math favors automated monitoring quickly.
WCSP’s water quality monitoring service exists precisely to replace this guesswork with hard, actionable data around the clock.
How Real-Time Water Quality Monitoring Works: The IoT Architecture
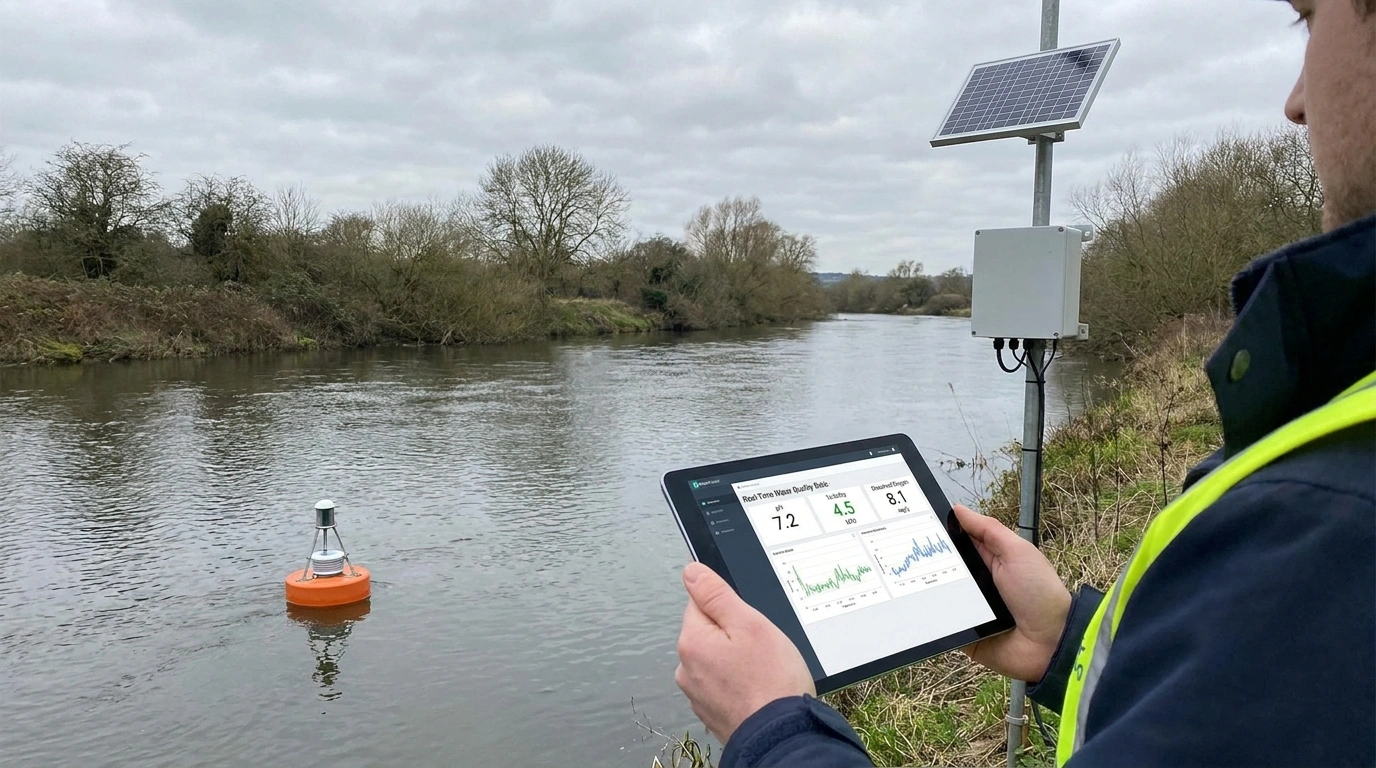
Real-time water quality monitoring combines in-line or submersible sensors, a data acquisition layer, cloud or edge computing, and a dashboard interface to give operators continuous visibility into water parameters — with alerts triggered the moment values drift outside acceptable bands.
Sensor Layer
The physical core of any IoT water monitoring system is its sensor array. Common parameters measured include:
pH — critical for process water and effluent compliance. Most NEQS-regulated discharge points require pH to stay between 6 and 10.
Turbidity — measures suspended solids loading. Sudden spikes indicate filter breakthrough or upstream process changes.
Total Dissolved Solids (TDS) and Conductivity — essential for RO plant performance monitoring and boiler feed water quality.
Dissolved Oxygen (DO) — vital for biological treatment systems like MBBR and MBR, where DO levels directly control microbial activity.
Chemical Oxygen Demand (COD) and BOD proxies — some advanced sensors estimate COD using UV absorbance or fluorescence, reducing reliance on weekly lab runs.
Temperature — affects reaction rates in biological treatment and scaling potential in heat exchangers.
Online water monitoring sensors are now available in robust IP68-rated housings that withstand harsh industrial environments, including the acidic streams common in Karachi’s leather tanneries and the high-TDS flows found in textile finishing in Gujranwala.
Communication and Data Layer
Sensor data transmits via 4G/LTE, LoRaWAN, or direct Ethernet to a central SCADA system or cloud dashboard. WCSP integrates monitoring hardware with automation platforms, enabling both live alerts and historical trending—essential for demonstrating NEQS compliance to environmental auditors and the Pakistan EPA.
Alerting and Response
When a parameter crosses a defined threshold, the system triggers an SMS or email alert to your plant manager, environmental officer, and treatment plant operator simultaneously. This compresses response time from hours to minutes.
Which Parameters Should Your Plant Monitor in Real Time?
The right monitoring parameters depend on your industry, your water source, and your discharge obligations under NEQS. Not every plant needs to track every analyte — but missing a critical one can be expensive.
For textile mills in Faisalabad and Lahore, pH, color, COD, and temperature are the minimum set. For pharmaceutical plants, conductivity, TOC, and microbial indicators matter more. For beverage manufacturers, pH, turbidity, and chlorine residual are front and center for both product quality and NEQS compliance.
Process Water vs. Effluent: Two Different Monitoring Goals
Process water monitoring protects your production. RO permeate quality directly affects pharmaceutical formulations, beverage recipes, and boiler efficiency. A TDS spike in your RO output that goes unnoticed for a shift can ruin a batch or scale up a heat exchanger in hours.
Effluent monitoring protects your license to operate. Pakistan’s NEQS set discharge limits for parameters including BOD, COD, TSS, heavy metals, pH, temperature, and oil and grease. Real-time discharge monitoring lets you generate automated compliance logs — a significant advantage during Pakistan EPA inspections, where manual logbooks are increasingly scrutinized.
WCSP’s wastewater treatment system services (link: /wastewater-treatment-system/) are commonly paired with IoT monitoring to create a closed-loop system: the sensor detects a deviation, triggers dosing or process adjustment, and logs the corrective action automatically.
IoT Water Monitoring vs. Traditional Lab Testing: A Direct Comparison
| Feature | Real-Time IoT Monitoring | Traditional Lab Testing |
|---|---|---|
| Data frequency | Continuous (every 1–15 minutes) | Once or twice daily |
| Response time | Seconds to minutes | Hours to days |
| Parameter coverage | 6–12+ parameters simultaneously | Typically 3–5 per test |
| Compliance log | Automated, timestamped | Manual, error-prone |
| Early warning | Yes — threshold alerts | No |
| Long-term trending | Yes — historical dashboards | Limited |
| NEQS audit readiness | High | Moderate |
| Upfront cost | Moderate (sensor + integration) | Low |
| Operational cost over 3 years | Lower | Higher (labor + lab fees) |
| Suitable for ZLD plants | Yes — essential | Insufficient |
How Real-Time Monitoring Protects Your Treatment Equipment
Every major water treatment technology — from reverse osmosis to MBR to electrocoagulation — has operating limits. Exceeding those limits, even briefly, accelerates fouling, scaling, and membrane damage. IoT monitoring gives your equipment the early warning system it never had.
In an RO plant, feed water SDI and TDS must stay within tight ranges. A sudden turbidity increase that fouls RO membranes can require a full chemical cleaning in 3 to 4 hours of abnormal feed conditions — at a cost of PKR 80,000 to 200,000 per cleaning cycle for a mid-sized unit, not including downtime. A turbidity sensor with a real-time alert can trigger upstream coagulation dosing before the membrane ever sees contaminated feed water.
In a membrane bioreactor , dissolved oxygen must be maintained between 1.5 and 3 mg/L for effective biological treatment. A DO sensor wired to the blower control system automatically adjusts aeration rate to match actual oxygen demand — saving significant energy while protecting biological performance. WCSP’s MBR installations consistently include DO-linked automation for this reason.
For electrocoagulation systems , conductivity monitoring ensures the wastewater ionic strength stays in the range required for efficient coagulation. Thin or over-diluted wastewater forces higher current draw and higher operating costs.
The pattern is consistent: smart water management means your treatment capital protects itself.
The most common mistake WCSP sees during plant audits is facilities that invest in treatment technology but skip the monitoring infrastructure entirely. They install a PKR 5 million MBR and monitor it with a handheld pH meter once a day. That is like buying a high-performance engine and never checking the oil. Real-time monitoring is not a luxury upgrade — it is the management layer that makes your treatment investment perform reliably year after year.
Smart Water Management: Turning Data Into Operational Decisions
Continuous sensor data is only valuable if someone acts on it. Smart water management means building the workflows, dashboards, and automation rules that convert raw readings into decisions — automatically where possible, and with human judgment where it matters most.
At the automation level, real-time monitoring integrates with dosing pumps, variable-speed blowers, backwash valves, and bypass systems. A pH sensor can trigger acid or alkali dosing in real time. A turbidity sensor can signal a coagulant dosing pump to increase output before suspended solids hit a downstream filter. This closed-loop control is standard in WCSP’s advanced treatment installations and dramatically reduces chemical overconsumption — a real concern for plants in Karachi and Lahore where chemical costs have increased sharply over the past two years.
At the reporting level, IoT systems generate daily compliance summaries, monthly trend reports, and exception logs automatically. When a Pakistan EPA auditor arrives, you hand them a USB drive with 12 months of timestamped data rather than a notebook with handwritten entries. That single difference has resolved compliance disputes for multiple WCSP clients without a single penalty.
At the strategic level, 6 to 12 months of high-resolution water quality data reveals patterns invisible to manual sampling — seasonal variation in source water TDS, process shifts that spike COD in specific production runs, and performance degradation curves for membrane systems. This data drives better decisions about when to schedule CIP cycles, when to replace filter media, and when to invest in capacity upgrades.
According to a McKinsey Global Institute report on industrial IoT, smart water management systems reduce unplanned downtime by up to 30% and cut water treatment operational costs by 15 to 25% in manufacturing facilities. For a Lahore textile mill spending PKR 3 million per month on water treatment operations, even a 15% reduction represents PKR 5.4 million saved annually.
Implementing Real-Time Water Quality Monitoring: A Step-by-Step Approach
Deploying an IoT water monitoring system is not a single event — it is a structured implementation that requires site assessment, instrument selection, integration, and commissioning. Done properly, it can be operational within 4 to 8 weeks for most industrial sites.
Step 1: Define your monitoring objectives. Compliance-only monitoring needs are different from process optimization needs. Identify which parameters are critical, which are nice to have, and where in the process each sensor needs to be placed.
Step 2: Conduct a site survey. Sensor placement depends on pipe sizes, flow velocities, pressure ranges, and access for maintenance. Submersible sensors work well for tanks and sumps; in-line sensors suit pressurized pipes in RO or UF systems.
Step 3: Select instruments matched to your water matrix. High-TDS brines, turbid textile effluents, and clean pharmaceutical water have very different fouling characteristics. Industrial-grade sensors with automatic cleaning mechanisms (ultrasonic or mechanical wipers) reduce maintenance burden in harsh applications.
Step 4: Design the data architecture. Decide between a local SCADA system, a cloud-based dashboard, or a hybrid. For multi-site operations across Lahore and Karachi, cloud-based centralized monitoring gives management visibility across facilities from a single interface.
Step 5: Integrate with treatment controls. Define the control logic: which sensor readings trigger which automated responses. This step requires close coordination between instrument engineers and process engineers.
Step 6: Commission and calibrate. All sensors require initial calibration against certified standards and periodic recalibration — typically every 3 to 6 months depending on the application. Build a calibration schedule into your maintenance program from day one.
Step 7: Train your operations team. The best system fails if operators don’t understand alerts or know how to respond. A 1-day operations training session at commissioning pays dividends for years.
WCSP’s online water monitoring sensors and integration services cover all seven steps, from feasibility assessment through operator training and ongoing support.
Conclusion
Real-time water quality monitoring is no longer a future upgrade — it is a present-day operational requirement for any industrial facility serious about compliance, cost control, and treatment performance. Manual sampling gives you a photograph of your water quality once a day. IoT-based real-time monitoring gives you a live video feed, 24 hours a day, 365 days a year.
Four things to take away from this article: First, continuous monitoring closes the compliance gap that manual testing leaves open — protecting your operating license under Pakistan’s NEQS regulations. Second, online water monitoring sensors protect your treatment capital by preventing the equipment abuse that happens when process deviations go undetected. Third, real-time data drives smarter operational decisions, reducing chemical usage, energy consumption, and unplanned maintenance costs. Fourth, implementation is faster and more accessible than most plant managers expect — typically 4 to 8 weeks from site survey to live dashboard.
If your plant is still relying on manual grab samples and weekly lab tests, you are managing your water quality blind. WCSP has helped industrial clients across Lahore, Karachi, Faisalabad, Sialkot, and Gujranwala make the shift to real-time monitoring — and the operational improvements are consistent and measurable.
Ready to upgrade your water treatment system? Contact WCSP’s expert team today. (link: /contact-us/)
Related topics to explore next:
- How to Choose the Right Sensors for Industrial Wastewater Monitoring in Pakistan
- MBR vs. MBBR: Which Biological Treatment Technology Suits Your Plant?
FAQ — Schema Ready
1: What parameters does a real-time water quality monitoring system measure?
A real-time water quality monitoring system typically measures pH, turbidity, total dissolved solids (TDS), conductivity, dissolved oxygen, temperature, and chemical oxygen demand (COD) via UV proxy sensors. The exact parameters depend on your industry and discharge obligations. For NEQS compliance in Pakistan, pH, COD, BOD, and TSS are most commonly required at discharge points.
2: How much does an IoT water monitoring system cost in Pakistan?
IoT water monitoring systems in Pakistan vary widely based on parameters monitored, number of measurement points, and integration complexity. A basic 4-parameter online monitoring station typically starts from PKR 400,000 to 700,000 installed. Full multi-point SCADA-integrated systems for large industrial facilities can range from PKR 2 million to 8 million. Operational savings typically recover the investment within 12 to 24 months.
3: Is real-time water quality monitoring required for NEQS compliance in Pakistan?
Pakistan’s NEQS regulations currently require industrial facilities to meet specific discharge standards but do not universally mandate continuous monitoring hardware. However, the Pakistan EPA increasingly expects larger industrial facilities — particularly in textile, leather, and food processing sectors — to maintain verifiable compliance records. Automated real-time monitoring provides the strongest evidentiary record during audits and enforcement actions.
4: How long does it take to install an IoT water quality monitoring system?
A standard industrial IoT water quality monitoring system takes 4 to 8 weeks from site survey to live commissioning, depending on the complexity of integration with existing SCADA or automation systems. Simple single-point monitoring installations can be completed in as little as 2 weeks. Multi-site cloud-integrated systems with automation tie-ins typically require 8 to 12 weeks.
5: Can online water monitoring sensors work with existing treatment equipment like RO plants or MBR systems?
Yes. Online water monitoring sensors integrate with existing RO plants, MBR systems, MBBR reactors, and electrocoagulation units through standard 4-20mA analog outputs or Modbus/RS-485 digital communication. Most industrial sensors are compatible with existing PLCs and SCADA platforms. Retrofit integration is common — WCSP regularly adds real-time monitoring layers to treatment systems originally installed without sensor infrastructure.
6: What is the difference between online water monitoring and SCADA-based water management?
Online water monitoring refers specifically to the sensor and data acquisition layer — the instruments that continuously measure water quality parameters. SCADA (Supervisory Control and Data Acquisition) is the broader control and visualization platform that uses sensor data to automate treatment processes, generate reports, and display dashboards. Real-time monitoring is the input; SCADA is the intelligence layer that acts on it. Most industrial smart water management deployments combine both.